Skip to content
Menu
LandWISE – Promoting sustainable land management
  • Welcome
    • About
    • LandWISE Committee
    • Contact
  • Projects
    • Carbon Positive
      • Carbon Positive Reports
    • Nitrachek: Farmer Friendly Nitrate Testing
    • SLAKES: a cost-effective measure of soil structural stability
    • Soil Repair after Cyclone Gabrielle
    • Vegetable Production Nitrogen Management
    • Best Management of Nitrates in Process Cropping
    • Future Proofing Vegetable Production
    • Herbicide Resistance Management
  • Events
    • Cyclone Gabrielle Research Symposium
      • Historical North Island Flood Events
      • An extraordinary storm: the severity of Cyclone Gabrielle’s weather in Hawke’s Bay
      • The Science Response in the Year of Storms; A Gisborne/Tairawhiti perspective
      • Insights into causes of landslides triggered by Cyclone Gabrielle
      • The effects of Cyclone Gabrielle on fruit tree health in Hawke’s Bay
      • Impact of Cyclone Gabrielle on stonefruit orchards in Hawke’s Bay: a case study
      • Charting the Course following Cyclone Gabrielle
      • Baseline sediment sampling in Tairawhiti and Hawke’s Bay
      • Impacts on cropping businesses
      • Understanding the flooding caused by Cyclone Gabrielle
      • Building Flood Damage from Ex-Tropical Cyclone Gabrielle
      • Food safety and critical incidents: A unified approach for safer produce
      • Silt nutritional status and contamination concerns
      • Lessons from the horticultural sector response to Cyclone Gabrielle
      • Ecological impacts of Cyclone Gabrielle
      • Cyclone Gabrielle and Poplar Windthrow in Northland
      • Seed Size and Establishment Method Determine Crop Recovery Following Cyclone-Induced Silt Deposition
      • Returning to (some) baseline sampling sites to assess cropping soil recovery
      • Recovery of annual cropping ground – Grower learnings
      • Recovery of Annual Cropping over 2 Years
      • Technical and extension learnings from Cyclone Gabrielle
    • Getting to Carbon Positive!
      • Getting to Carbon Positive – Presenters
    • Rebuilding Our Soils
      • Rebuilding Our Soils – Presenters
    • Events Archive
  • Tools
    • Nitrachek Calculator
    • Carbon Calculator
    • Nutrient Budget
    • Irrigation Evaluation – IRRIG8
      • IRRIG8: Centre Pivot
        • IRRIG8-online: Centre Pivot User Guide
      • IRRIG8: Linear Move
      • IRRIG8: Travelling Irrigator
        • IRRIG8-online: Travelling Irrigation User Guide
      • IRRIG8: Multiple sprayline calculator
      • IRRIG8: Solid set irrigation
      • IRRIG8: Pressure and energy
        • Pressure and Energy Calculator: User Guide
    • ANOVA Tool for statistical significance
    • Fertspread Spreader Calibration
    • Fertspread Placement Calibration
    • Soil Infiltration Calculator
      • Disc Permeameter User Guide
      • Disc Permeameter Calculator: Frequently Asked Questions
  • Blog
  • Sign Up
  • Login
  • Members Only
    • Online Learning
  • Account
  • Site Search
LandWISE – Promoting sustainable land management

Carbon Positive Winter 2023

Posted on November 5, 2023

Results from monitoring

Cover crop growth

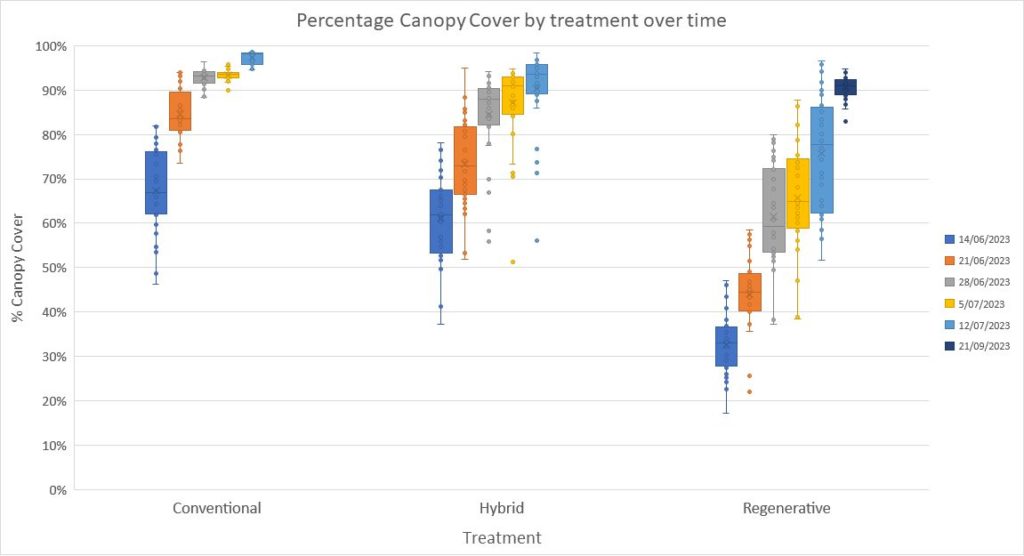
As seen in the boxplot chart above, the canopy cover (percentage of the ground covered by the cover crops in each treatment) varied with the conventional annual ryegrass planted into cultivated soil getting most cover earliest, and the regenerative oats/vetch and lupin mix direct-drilled into uncultivated soil starting slowest. The regen cover crop mix still had gaps even at the end of September, by which time the ryegrass had been terminated in the hybrid plots and grazed in the conventional ones.

NOTE: Box plots show both the difference between treatments and the difference within a single treatment. The dark-blue box at the furthest left shows the range of ground cover percentages measured in the conventional system plots on the 14th of June. The centre and right dark-blue boxes show the same for the hybrid and regenerative systems plots. The stretched boxes and lines show there is a lot of variation within each system, and the different positions of the boxes show there is a lot of variation between the systems, with conventional having the most ground cover and regenerative having the least. The other colours show the same things at different times over the winter.

The amount of dry matter produced under each system, however, tells a different story.

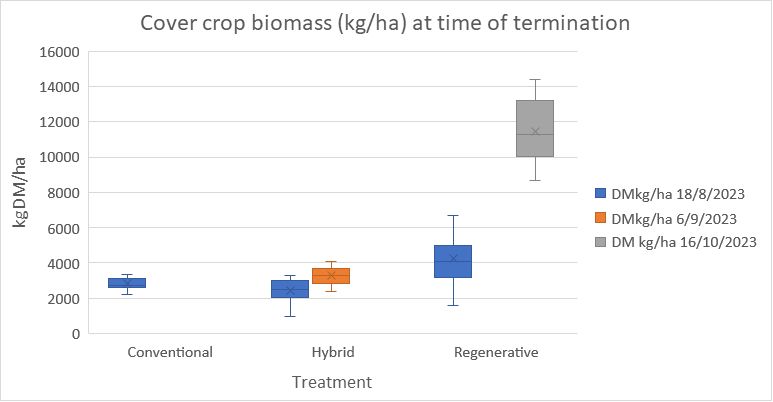
In the box plot above, we see there was not very much difference in the dry mass of cover between the three growing systems in mid-August, although it looks as though the regenerative oats/vetch/lupin mix might be a little bit higher. Because there is quite a lot of overlap between the three treatments (growing systems) we found there was not a significant statistical difference. That means we couldn’t be sure they were actually different to one another. We stopped measuring the conventional system after August because it was being grazed by lambs. When we measured the hybrid plots again in September, before we sprayed them out to get ready for strip-tilling, we found they had increased a little, and were more even across the plots. By mid-October when we weighed the amount of biomass in the regenerative plots, we found there was a lot of material. This was what was needed for the planned mulch planting.

Cover crop nutrients

When the regenerative treatment cover crop was terminated, samples were sent to Hill Laboratories for testing. The levels of key macronutrients are shown in the chart below.

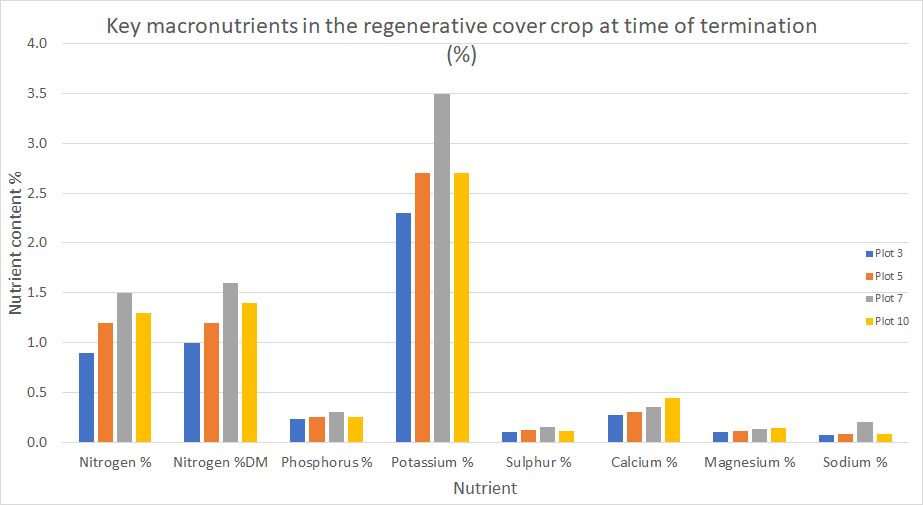
The chart shows that the nutrient levels in the regenerative plots are a little variable. In general, plot 3, which produced the least amount of biomass over the winter, also had comparatively lower nitrogen, phosphorus, potassium, sulphur, calcium and magnesium, when compared to the other three plots. We also found that the western end on plot 3 had the lowest baseline soil carbon level of any plot. We do not know yet what is behind these findings, so can only say there seems to be some correlation.

Slugs

Slug pressure was measured using the Oregon State University ‘Relative Slug Activity’ method. Four flowerpot bases were placed in each plot along the existing transect. Lids were left for several days. Slugs on each lid, and in the plant matter under each lid, were counted and weighed. This measure does not give ‘total number of slugs per hectare’, but it does provide a relative measure of slug pressure. The number of slugs per lid varied from 0 – 10, and the total weight varied from 0 – 7.5 g/lid.

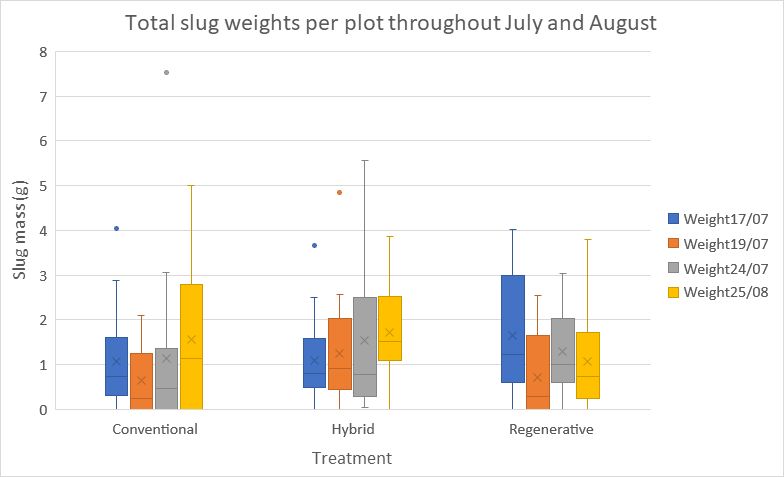
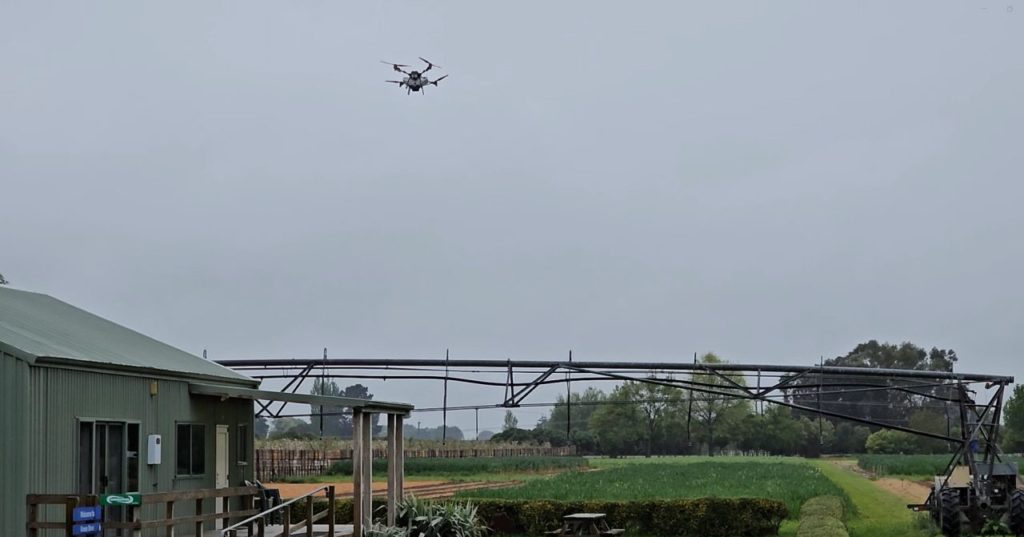
As a result of monitoring, it was determined that slug controls should be applied prior to planting. The best time for this was before we mulched the regenerative cover crop, and we applied 10 kg/ha of IronMax using an Airborne Solutions drone.

Visual Soil Assessment

Visual Soil Assessment (VSA) was delayed due to high soil moisture conditions, but was completed over several days before groundwork commenced. Most VSAs were done in the plots, but some samples were dug out to ensure soil wasn’t disturbed by cultivation activities, and the assessments done in the shed.

All VSA results across all plots ranked as ‘Moderate’, with total scores ranging from 15.5 – 20.6.

Photos of VSA tests of (left) a conventional plot cultivated and drilled in annual ryegrass and (right) a direct-drilled regenerative plot following winter oats/vetch/lupins. The regenerative plots had a higher proportion of larger blocky clods.

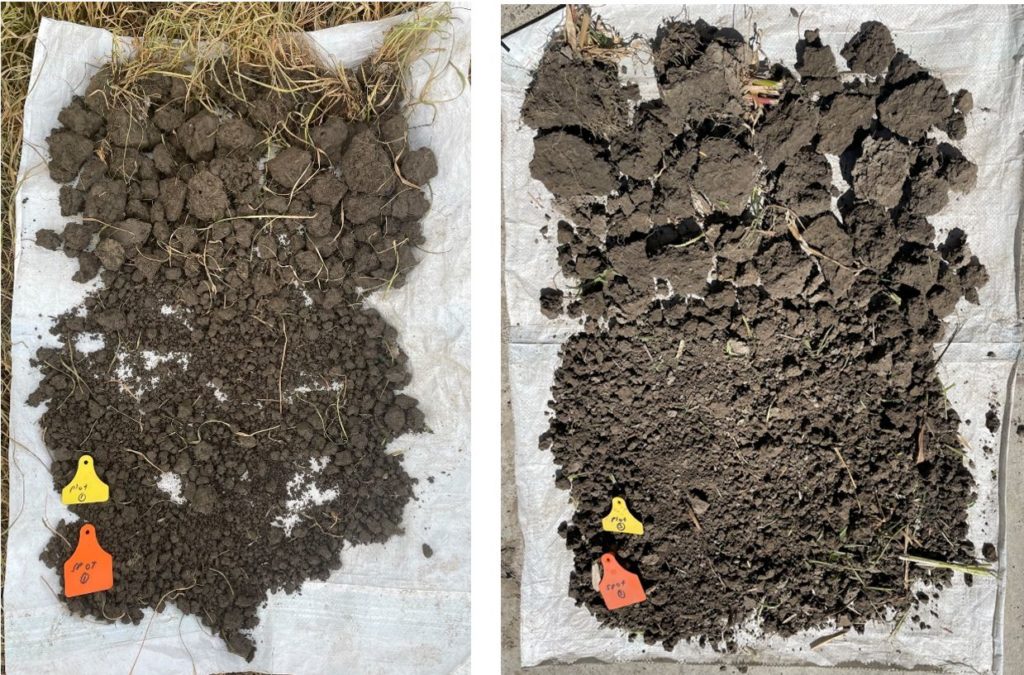
The conventional ryegrass had been cultivated after the sweetcorn crop and had more, finer roots than the uncultivated regenerative oat/vetch/lupin crop. We noted that soil in the regenerative treatment plots was drier than in the other treatments. This makes sense, because the ryegrass was terminated much earlier than the oats mix, and therefore had much less evapotranspiration. In the regenerative treatment plots, the soil structure was blockier and harder to break up. This may be due to historical compaction issues and limited mechanical loosening (worsened by a wet season), or due to the oats taking up more moisture from the soil.

  • Cyclone Gabrielle Research Symposium
  • Biodiversity Strips Update
  • Carbon Positive: Butternuts
  • Carbon Positive: Butternut Planting to Side Dressing
  • Nitrate Levels on the MicroFarm
  • Cyclone Gabrielle Research Symposium
  • Introducing Carys Luke, our Summer Intern
  • Soil Infiltration Calculator
  • MicroFarm Biodiversity Update
  • Irrigation System Testing
  • Carbon Positive: Butternut Planting
  • NZARM Conference 2025

RECENT POSTS

  • Cyclone Gabrielle Research Symposium
  • Biodiversity Strips Update
  • Carbon Positive: Butternuts
  • Carbon Positive: Butternut Planting to Side Dressing
  • Nitrate Levels on the MicroFarm

CATEGORIES

  • Agritech
  • Asparagus
  • Conference
  • Courses
  • Cover crops
  • Cultivation
  • Events
  • Fresh Vegetables
  • Irrigation
  • Membership
  • Nitrate
  • Nutrition
  • People
  • Permanent crops
  • Pests
  • Process Crops
  • Projects
  • Protected cropping
  • regenerative agriculture
  • Regulations
  • Research
  • soil health
  • Sustainable technology
  • Uncategorized
  • Water resources
  • Weeds
©2023 LandWISE – Promoting sustainable land management

Disclaimer: Any information on the LandWISE website or linked LandWISE resources is of a general nature only. We endeavour to provide accurate and adequate information relating to the subject matters contained in it. It has been prepared and made available to all persons and entities strictly on the basis that LandWISE, its researchers and authors are fully excluded from any liability for damages arising out of any reliance in part or in full upon any of the information for any purpose. No endorsement of named products is intended nor is any criticism of other alternative, but unnamed product.