
Table of Contents
- Introduction
- Getting Started
- Step-by-Step Instructions
- Understanding Results
- Export Functions
- Technical Standards
- Troubleshooting
- Frequently Asked Questions
Introduction
The Centre Pivot Calculator is a comprehensive evaluation tool designed to assess the performance of centre pivot irrigation systems. Based on ISO 11545:2001 standards and the New Zealand Code of Practice for Irrigation Evaluation 2005, this calculator helps irrigation professionals, consultants, and farmers evaluate distribution uniformity and system performance.
What This Calculator Does
- Distribution Uniformity Analysis: Calculates Low Quarter Distribution Uniformity (DUlq) and Heermann-Hein Uniformity Coefficient (CUr)
- Performance Classification: Rates system performance from Excellent to Unacceptable
- Professional Reporting: Generates comprehensive reports with recommendations
- Data Export: Exports results in CSV and text report formats
Who Should Use This Calculator
- Irrigation consultants and engineers
- Farm managers and owners
- Agricultural advisors
- Regulatory compliance officers
- Research institutions
Getting Started
System Requirements
- Modern web browser (Chrome, Firefox, Safari, Edge)
- Internet connection (for Chart.js library)
- No special software installation required
Accessing the Calculator
The calculator is accessed through a webpage containing the shortcode Supporting the Irrigation System Evaluation Code of Practice - Section 4.7 Professional Analysis with Enhanced Security & Reporting Upload a CSV file with collector data. Supported formats: Complete the collector data entry and calculate results to see analysis here. Key Calculations (Code of Practice Section 4.7): . Simply navigate to the page and the calculator will load automatically.🌾 Centre Pivot Irrigation Evaluation Calculator v1.0.2
📄 Upload Collector Data from CSV
📊 Centre Pivot Distribution Uniformity Analysis v1.0.2
📋 Report Features v1.0.2
Step-by-Step Instructions
Tab 1: Farm Info
Purpose: Record essential information about the farm, evaluation, and consultant details.
Required Information:
Farm Details:
- Farm Name: Enter the property name (e.g., “Sunrise Valley Farm”)
- Farm Owner/Manager: Person responsible for the operation
- Farm Location: Physical location (e.g., “Canterbury, New Zealand”)
Consultant Details:
- Consultant/Evaluator Name: Professional conducting the evaluation
- Organisation: Company or institution name
- Evaluation Date: Date of the field evaluation (auto-fills with today’s date)
Tips:
- Complete all fields for professional reports
- Use consistent naming conventions for multiple evaluations
- The evaluation date is used in all exported reports
Tab 2: Machine Setup
Purpose: Configure the technical specifications of the centre pivot system.
Equipment Information:
Basic Details:
- Irrigation Machine: Brand/model (e.g., “Valley 7000 Series”)
- Machine Model/Serial: Specific model and serial number
- Total Machine Flow: Flow rate in L/s (including end gun if operating)
Critical Measurements:
Effective Radius ⭐ Most Important:
- Distance from pivot center to end sprinkler
- Add 75% of end sprinkler wetted radius
- Typical range: 200-500 meters
- Example: If machine length is 380m and end gun adds 25m wetted radius: 380 + (25 × 0.75) = 398.75m
Machine Length:
- Distance from pivot center to end tower
- Usually 20-50m less than effective radius
Soil Infiltration Rate:
- Basic infiltration rate of soil in mm/hour
- Critical for assessing application rate compatibility
- Typical values: 15-35 mm/hr for most soils
Important: The effective radius is used in all calculations. Ensure this measurement is accurate.
Tab 3: Collector Data
Purpose: Input field measurement data from the distribution uniformity test.
Step 1: Test Setup
Number of Collectors:
- Minimum: 8 collectors (basic evaluation)
- Standard: 40 collectors (machines >450m)
- Recommended: 16-24 collectors for most evaluations
- Select “Custom number” for non-standard quantities
Collector Spacing:
- Uniform spacing: Automatically calculates distances along radius
- Manual distance entry: Enter custom distances for each collector
Step 2: Test Conditions
Evaporation Measurements:
- Evaporation Volume: Volume lost from control collector in mL
- Evaporation Test Duration: Time control collector was exposed (hours)
- Control Collector Diameter: Diameter of control collector (mm)
- Calculated Rate: Automatically computed evaporation rate in mm/hr
Process:
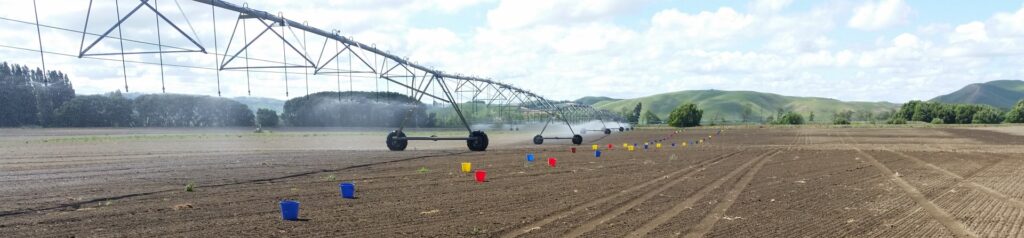
- Place control collector in representative location (not under sprinklers)
- Expose for same duration as test collectors
- Measure volume lost due to evaporation
- Click “Calculate Evaporation Rate” button
- System automatically calculates mm/hr rate and applies to all collectors
Test Duration:
- Total time collectors were exposed (hours)
- Standard test: 1-3 hours
- Longer tests provide more accurate results
Collector Diameter:
- Opening diameter in millimeters
- Standard rain gauge: 250mm
- Required for depth calculations
Step 3: Data Entry Options
Quick Fill Features:
- Fill All Same: Apply single volume to all collectors
- Fill Random Range: Generate volumes within specified range
- Generate Sample Data: Create realistic test data for demonstration
- Clear All: Remove all entered data
Manual Entry:
- Distance: Distance from pivot center (auto-calculated for uniform spacing)
- Volume: Collected volume in mL
- Collection Time: Duration for this specific collector (minutes)
Data Entry Tips:
- Start from innermost collector and work outward
- Double-check distance measurements
- Record any unusual conditions (blocked sprinklers, etc.)
- Use sample data function to understand expected patterns
Tab 4: Results
Purpose: View calculated results, interpretations, and export options.
Calculation Process:
- Click “Calculate Distribution Uniformity”
- Wait for processing (usually instant)
- Review results in the Results tab
What You’ll See:
Performance Metrics:
- DUlq: Low Quarter Distribution Uniformity (0-1.0 scale)
- CUr: Heermann-Hein Uniformity Coefficient (0-1.0 scale)
- Averages: Low quarter and overall volume averages
Classification System:
- Excellent: DUlq ≥ 0.94
- Very Good: DUlq 0.87-0.94
- Good: DUlq 0.75-0.87
- Fair: DUlq 0.62-0.75
- Poor: DUlq 0.50-0.62
- Unacceptable: DUlq < 0.50
Understanding Results
Distribution Uniformity (DUlq)
What it means: Ratio of the average volume collected by the lowest 25% of collectors to the overall average volume.
Interpretation:
- Higher values = Better uniformity
- 0.90 or above: Excellent performance
- 0.75-0.89: Good performance, minor improvements may help
- Below 0.75: System needs attention
Uniformity Coefficient (CUr)
What it means: Weighted measure of distribution uniformity considering distance from pivot.
Use: Provides additional validation of DUlq results and accounts for radial variations in centre pivot systems.
Performance Recommendations
Excellent (≥0.94):
- Continue current maintenance practices
- Monitor for any changes over time
Very Good (0.87-0.94):
- System performing well
- Standard maintenance sufficient
Good (0.75-0.87):
- Check sprinkler conditions and pressure regulators
- Minor adjustments may improve performance
Fair (0.62-0.75):
- Inspect for worn nozzles and pressure variations
- Consider system upgrades
Poor/Unacceptable (<0.62):
- Comprehensive system evaluation required
- Check all components: pressure system, nozzles, alignment
- May require significant repairs or replacement
Export Functions
📊 Export Data (CSV)
Purpose: Export raw collector data for further analysis.
File contents:
- Distance from pivot (meters)
- Collected volume (mL)
- Adjusted volume (mL, after evaporation correction)
- Collection time (minutes)
Uses:
- Import into spreadsheet software
- Statistical analysis
- Data backup
- Sharing with other professionals
📄 Generate PDF Report
Purpose: Create comprehensive evaluation report.
Report sections:
- Farm and consultant information
- Executive summary with key metrics
- Detailed findings and measurements
- Performance classification
- Professional recommendations
- Complete collector data table
Uses:
- Client deliverables
- Regulatory compliance
- Insurance claims
- Record keeping
📧 Email Results
Purpose: Quick sharing of results.
Features:
- Pre-formatted email template
- Professional subject line
- Instructions for downloading detailed reports
🖨️ Print Report
Purpose: Hard copy documentation.
Features:
- Print-optimized formatting
- Hides interactive elements
- Clean, professional layout
Technical Standards
ISO 11545:2001 Compliance
This calculator implements the international standard for Agricultural irrigation equipment – Centre-pivot and moving lateral irrigation machines with sprayer or sprinkler nozzles – Determination of uniformity of water distribution.
NZ Code of Practice 2005
Follows the New Zealand Code of Practice for Irrigation Evaluation 2005 guidelines for:
- Collector spacing requirements
- Calculation methodologies
- Performance classification standards
- Reporting requirements
Key Equations Implemented
Distance-Adjusted Distribution Uniformity (Equation 31):
- Accounts for varying distances from pivot
- Weights measurements by collector distance
Heermann-Hein Uniformity Coefficient (Equation 34):
- Radial uniformity coefficient for centre pivot systems
- Considers distance-weighted deviations
Troubleshooting
Common Issues and Solutions
“Please enter effective radius” Error
Problem: Calculation fails due to missing effective radius. Solution: Complete the Machine Setup tab before attempting calculations.
“Please enter at least 4 collector measurements” Error
Problem: Insufficient data for calculations. Solution:
- Enter distance and volume for minimum 4 collectors
- Ensure all required fields are completed
- Check for empty or invalid entries
No Collector Input Fields Displayed
Problem: Collector grid doesn’t appear after selecting number. Solution:
- Ensure number of collectors is selected
- Try refreshing the page
- Check if effective radius is entered in Machine Setup
Unexpected Results
Problem: Results seem unreasonable. Solution:
- Verify effective radius measurement
- Check collector distance calculations
- Ensure volume measurements are in mL
- Review evaporation loss settings
Export Functions Not Working
Problem: CSV or report downloads fail. Solution:
- Ensure pop-up blockers are disabled
- Check browser download permissions
- Try different browser if issues persist
Browser Compatibility
Recommended browsers:
- Chrome 90+
- Firefox 88+
- Safari 14+
- Edge 90+
Known issues:
- Internet Explorer not supported
- Some mobile browsers may have limited functionality
Frequently Asked Questions
General Questions
Q: How accurate are the calculations? A: The calculator implements internationally recognized standards (ISO 11545:2001) and follows established calculation methods. Accuracy depends on the quality of field measurements and proper use of the tool.
Q: Can I save my work and return later? A: Currently, data is not automatically saved. We recommend exporting your data regularly and completing evaluations in single sessions.
Q: Is internet connection required? A: Yes, an internet connection is required to load the Chart.js library for any graphical displays. The core calculations work offline once the page is loaded.
Technical Questions
Q: What’s the difference between DUlq and CUr? A: DUlq (Distribution Uniformity low quarter) measures how uniformly the lowest-performing 25% of the system compares to the average. CUr (Uniformity Coefficient radial) is a distance-weighted measure that accounts for the radial nature of centre pivot systems.
Q: Why is effective radius so important? A: Effective radius determines the irrigated area and is used in all uniformity calculations. An incorrect effective radius will make all subsequent calculations invalid.
Q: How many collectors do I really need? A: While 8 is the minimum, more collectors provide better accuracy:
- 8-12 collectors: Basic evaluation
- 16-24 collectors: Standard professional evaluation
- 40+ collectors: Detailed research or compliance testing
Q: What evaporation rate should I use? A: Don’t enter a rate directly. Instead:
- Place a control collector away from sprinklers
- Measure volume lost due to evaporation (in mL)
- Record the exposure time (hours)
- Enter control collector diameter (mm)
- Click “Calculate Evaporation Rate” for automatic mm/hr calculation
Typical evaporation rates vary by conditions:
- Low wind, cool: 2-4 mm/hr
- Moderate conditions: 4-6 mm/hr
- Hot, windy: 6-10 mm/hr
Practical Questions
Q: When should I test my pivot? A:
- New installations: Before final acceptance
- Regular monitoring: Every 2-3 years
- After major repairs: Following nozzle changes or system modifications
- Performance concerns: When uniformity appears poor
Q: What weather conditions are best for testing? A:
- Wind speed: Less than 3 m/s (11 km/h)
- Temperature: Avoid extreme heat (>35°C)
- Rain: No precipitation during test
- Timing: Early morning or late afternoon preferred
Q: Can I test while the end gun is operating? A: Yes, but ensure you include the end gun flow in the total machine flow and extend collector placement to cover the end gun coverage area.
Q: What if my results show poor uniformity? A: Poor results indicate system problems. Check:
- Sprinkler nozzle condition and alignment
- Pressure regulation and distribution
- Structural alignment and tower positioning
- Flow control devices and pressure regulators
Reporting Questions
Q: Are the reports suitable for regulatory submission? A: The reports follow established standards and provide professional documentation. However, check with your specific regulatory body for any additional requirements.
Q: Can I customize the report format? A: The current version provides standardized reports. For custom formatting, consider exporting the CSV data and creating custom reports in spreadsheet software.
Q: How long should I keep evaluation records? A: Recommended retention periods:
- Compliance testing: As required by local regulations (typically 5-10 years)
- Insurance purposes: Duration of policy plus 2 years
- Performance monitoring: Indefinitely for trend analysis
Support and Additional Resources
Getting Help
If you encounter issues not covered in this guide:
- Check browser compatibility and update if necessary
- Try refreshing the page and re-entering data
- Contact your system administrator for technical support
- Consult with irrigation professionals for interpretation assistance
Professional Services
For complex evaluations or when regulatory compliance is critical, consider engaging qualified irrigation consultants who can:
- Conduct comprehensive field evaluations
- Provide detailed analysis and recommendations
- Ensure compliance with local regulations
- Assist with system improvements
Standards References
- ISO 11545:2001: Agricultural irrigation equipment – Centre-pivot and moving lateral irrigation machines
- NZ Code of Practice for Irrigation Evaluation 2005: New Zealand irrigation industry standards
- ASAE Standards: American Society of Agricultural Engineers irrigation guidelines
This user guide is designed to help you get the most from the Centre Pivot Calculator. For the most current version of this guide and any updates to the calculator, please check the website where you accessed this tool.
Version: 1.0
Last Updated: 2025
Document Type: User Guide – Centre Pivot Calculator