One way to track greenhouse gas emissions is through carbon accounting. Carbon accounting quantifies carbon dioxide, methane, and nitrous oxide emissions. We have been tracking the relative emissions from each of the three different management systems applied in our Carbon Positive trial.
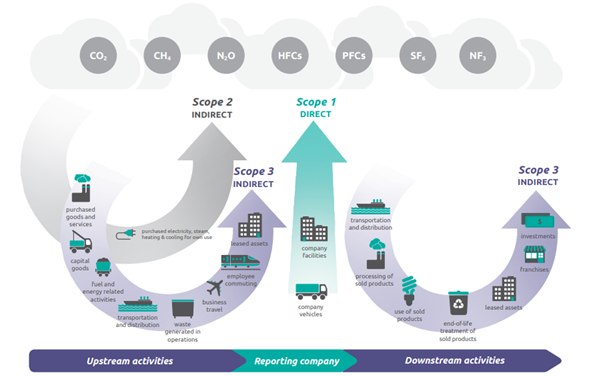
There are three scopes within carbon accounting: Scope 1, Scope 2 and Scope 3. Scope 1 is direct GHG emissions from sources controlled or owned by a business. Scope 2 is indirect GHG emissions from electricity purchased by a business. Scope 3, which is broken down into 15 categories, is all other indirect GHG emissions not controlled or owned by a business.
Carbon accounting calculator
We developed a carbon accounting calculator that quantifies the emissions from the different management systems. We are considering making it into a webtool for others to use.
The Scope 1 emissions we considered were fertiliser use, fuel use, and livestock. The Scope 2 emission was from the power used to run the Irrigator. Scope 3 emissions were from the manufacturing and transportation of fertilisers and agrichemicals.
We set the farm gate as our boundary for crops produced, so we have not calculated transport to the factory (the same for all treatments), food processing, sales or home cooking etc. We have included those factors that make most impact and that are within our control. This parallels the Gross Margin accounting we use to assess profitability of the different treatments in our trial.
Emission factors were used to determine the CO2 equivalent (CO2-e) for each operation within the Carbon Positive trial. An emission factor is a coefficient that converts an activity to a greenhouse gas emission. For example, 1 kilogram of non-urea nitrogen has an emission factor of 4.84 kg CO2-e; therefore, you multiply the amount of fertiliser used by the emission factor to determine total emissions.
- The emission factors for fertiliser, fuel use, livestock, and power were all sourced from the Ministry for the Environment: Te ine tukunga: He tohutohu pakihi Measuring emissions: A guide for organisations.
- The fertiliser manufacturing emission factors were sourced from Wells 2001: Total energy indicators of agricultural sustainability: Dairy farming case study.
- The fertiliser transportation emission factor is an average of different fertilisers being transported to New Zealand, sourced from Ledgard & Falconer 2019: Update of the carbon footprint of fertilisers used in New Zealand.
- The emission factors for agrichemicals manufacturing and transportation were sourced from Audsley et al. (2009): Estimation of the greenhouse gas emissions from agricultural pesticide manufacture and use, with original data from Green (1987). Emission factors for the active ingredients were used if available; otherwise, the average value was used for the agrichemical type: Herbicide, Fungicide, or Insecticide.
Carbon accounting calculator results
Over 2022-2025, the first 3 years of the Carbon Positive trial, the Conventional treatment had the highest emissions (5,906 kg CO2-e). The Hybrid treatment (4,401kg CO2-e) was next, and the Regenerative treatment (3,575 kg CO2-e) was lowest. Nitrogen fertiliser followed by fuel were the highest emission sources in all treatments.
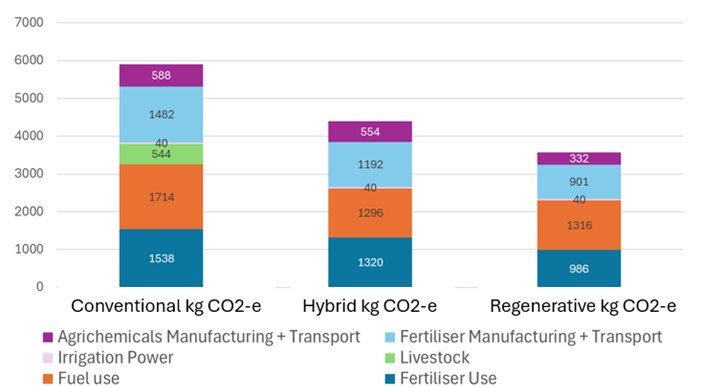
In the first three years, only the conventional plots had sheep grazed on them. The other plots were left in ungrazed cover crops. Over later winter 2025, we did have sheep grazing on all three treatments and they will show up in our next update. Note from the chart above, that sheep had about the same emissions as our agrichemicals.