
Assessing performance 2: Spread Pattern
For a broadcast machine, the basis of the spread pattern test is collector trays placed at equal distances across the direction of spreader travel. The trays must extend the full width of the spread pattern, which is usually greater than the bout spacing or swath width.
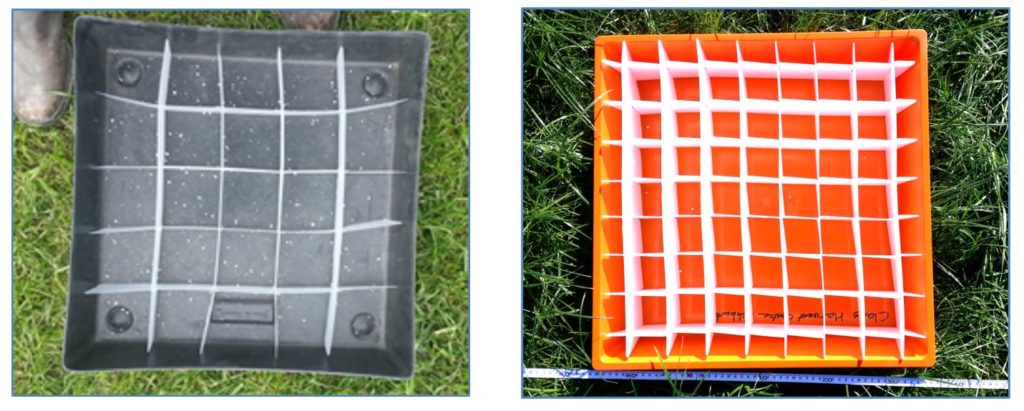
Tray design is critical for useful information to be obtained. Standard fertiliser test trays are recommended. These are typically 500mm x 500mm square (0.25m2). They will have internal baffles to stop fertiliser pellets or granules bouncing out. There is some question still about the collection efficiency of these baffled trays. Deeper trays with sunken baffles may capture more than shallower trays with flush baffles. We believe the relative catch efficiency is similar in the trays regardless of their position, but do not rely only on tray catch measurements to calculate the actual application rate (see the previous section).
Tray Layout
Testing Broadcast spreaders uses a line of trays laid in the field across the spreader travel path. One tray is placed on the centre line of the spreader drive path. Remaining trays are placed to the left and right to at least the furthest extent of fertiliser spread. The trays are equally spaced ideally with one tray in the centre of each adjacent spreader drive path.
Note: Do not place trays in wheel tracks!! Some sideways realignment is acceptable for these trays.

A line of trays laid out in a paddock is shown below. Note that they are set level and have been spaced equally against a tape measure.

In-Field overlap
Spread trays evenly between three adjacent spreader passes and apply fertiliser, as shown above.
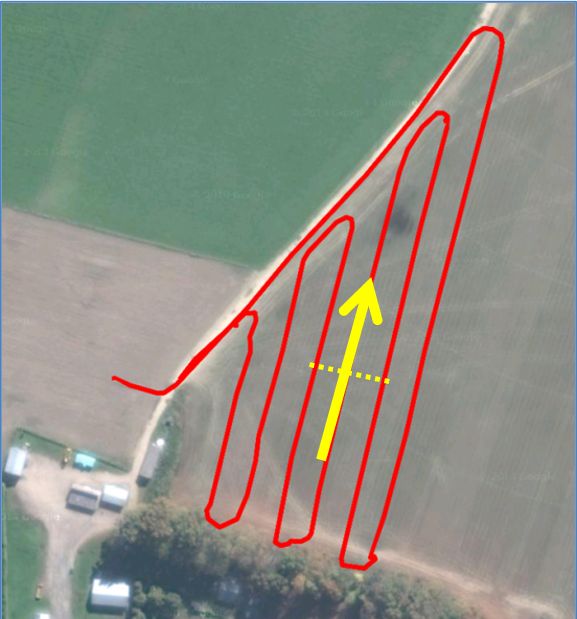
The picture to the right shows an “up-and-back” or “to-and-fro” application path. In this case area “a” receives overlapped applications from the left side of the spreader and area “b” receives overlapped applications from the right side of the spreader. It is valuable to compare the two sides individually as well as combined. Some spreaders, in particular types of single disk spreader, have a tendency to put a greater amount out on one side of the machine. Going round-and-round a paddock may give better results.

Mathematical Overlap
While applying fertiliser on adjacent passes physically overlaps the applications, is it useful to measure a single pass. The single pass data can be manipulated to assess both current practice and alternatives, such as different swath or bout widths, and the effect of running round-and-round or to-and-fro. Ensure the trays are placed out at least as far as the furthest fertiliser particles get spread. This may be further that adjacent passes. All fertiliser applied must be measured and data will be used by the overlap formulae.
Recording Application Data
Collecting and weighing samples is the preferred method. Because of the very small quanities involved, it is generally best to collect samples into snaplock/ziplock plastic bags and weigh them inside out of any wind.
Because the weight of fertiliser applied is the feature of interest, weighing samples is a sensible measurement method. However the amounts caught can be very small – less that a gram and even less than a tenth of a gram.
Very high resolution scales are needed. Scales that weigh to 0.01 gram are readily available at reasonable cost and have reasonable accuracy. These scales need to be set on a horizontal surface and are affected by air movement. Weighing is best done inside to avoid problems.

Accounting for Overlap
If the in-field overlap test is used, no further accounting for the effects of double application from adjacent passes is required.
If the mathematical overlap test is used, the effect of adjacent passes must be taken into account. The test assumes adjacent passes will have the same spread pattern as the one measured in the field. The overlapped result is obtained by summing multiple spread patterns offset by the bout width or swath spacing. If a round-and-round drive pattern is used, the spread pattern is simply moved sideways by the appropriate amount. If a to-and-fro drive pattern is used, alternative spread patterns must be reversed (a mirror image is offset by the appropriate distance. In practice this is a difficult process and use of prepared software such as FertSpread is recommended.
Quantifying Spread Variability (Uniformity)
The variability of application is described statistically. The measurement used is the coefficient of variation (CV) which describes how much the individual measured quantities vary from the average of them all. A low CV means there is little variation. A high CV means there is a lot of variation. The Standard Deviation measures the amount individual measurements vary from the average. The coefficient of variation is calculated by dividing the standard deviation by the mean of all results.

