
Broadcast Spreader Assessment
Broadcast PTO
If you selected the Broadcast PTO option, you must enter the Bout Width, Spread Width and whether you drive To and Fro (TF) or Round and Round (RR) the paddock. These are critical calculation items.
The other boxes are important to record so you can compare results with previous or future tests which might be done differently.

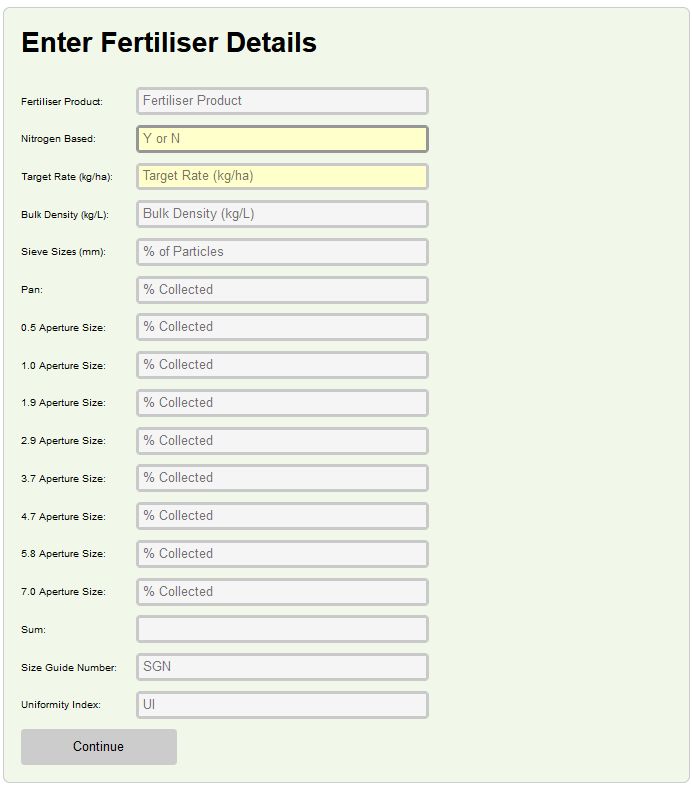
Fertiliser Details
This form is used to record details for the fertiliser product used for the spreader assessment. You must say if the fertiliser is nitrogen based or not, and you must enter a Target Application Rate. These are used in reporting the results of your test.
The form also includes voluntary fields that are used to calculate product Size Guide Number (SGN) and Uniformity Index (UI). You need a special sieve to determine the amount of a product in each size range. Fill in the boxes if you want the information for future comparisons.
Catch Details
This form records information about the layout of catch trays and the amount of product caught in each.
- Enter the number of trays used
- Enter the tray size
- Enter the tray spacing
- A table will appear with a line for each tray
- Optionally wind details (0o is direction of travel, 90o is from right side looking in travel direction)
- Enter the catch data for each tray. (Zero is the tray under the spreader, Left is trays to the left when looking in the direction of travel)

NOTE: Clicking the [CONTINUE] button saves the project in a database so reports can be created. Exiting before this stage will result in data being discarded.
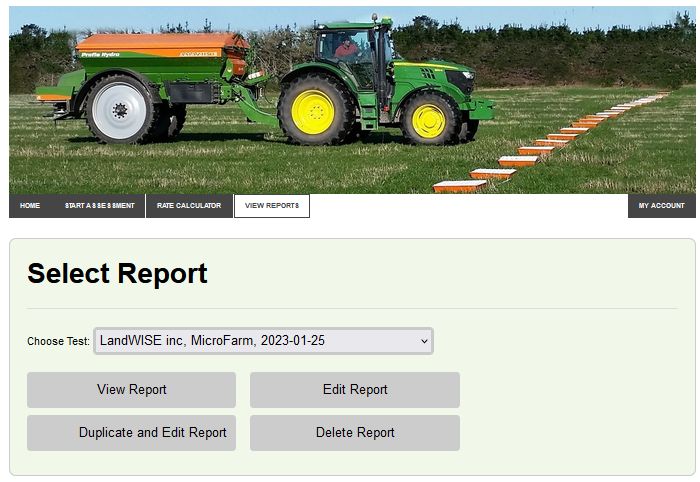
View Reports
Once all your data have been entered, select the “View Reports” tab and calculations will be completed.
Click View Report to get the results from your equipment assessment.
Click Create pdf to download a printable report for your records.
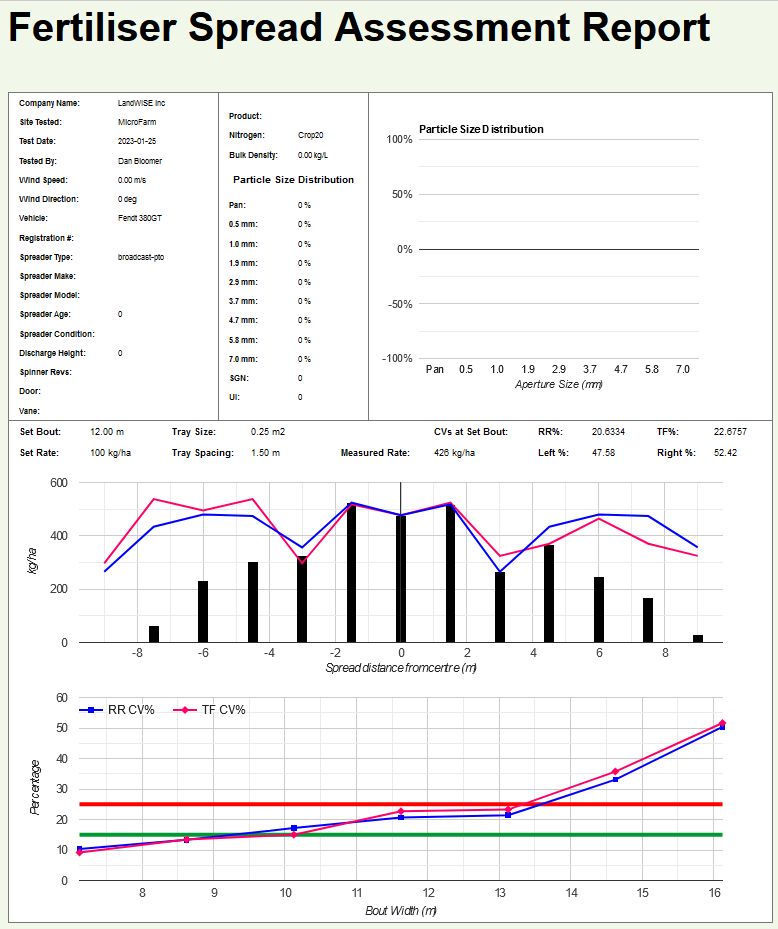
The centre graph shows the amount of fertiliser caught in each tray (black bars), and the amount applied across the bout width once overlapping is accounted for, using either To and Fro (red line) or Round and Round (blue line) passes.
The bottom graph shows how the application uniformity (coefficient of variation, CV) changes as bout width increases. This lets you decide if you should close up or spread out passes.
In the example shown, the catch data show that machine adjustments are needed to improve the spread pattern. A tweak to setting could even out the centre and make the overlapped result more even.
Watch a review
Does this report show the machine is satisfactory for applying nitrogen fertilisers?
Does it show it is satisfactory for applying non-nitrogen fertilisers?