
Validation and Practical Implementation of the Nitrachek 404
Have you tried to match soil test strip colours against the colours on the tin, and found yourself wondering if you’re seeing the right shade of purple? Those days of guesswork can be over.
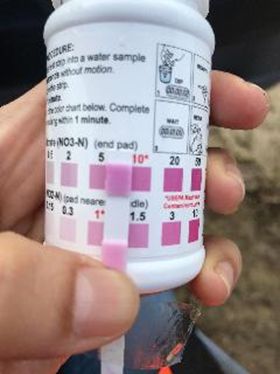
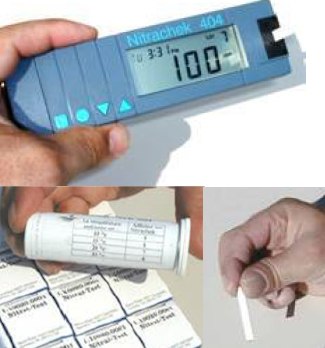
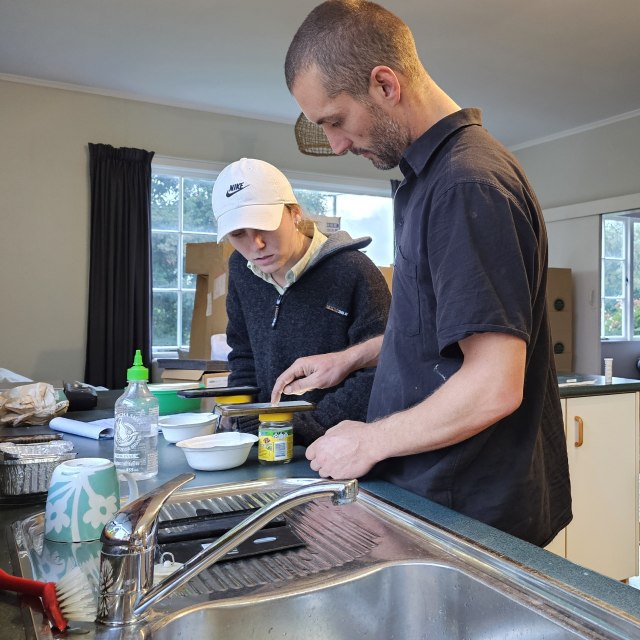
The Nitrachek 404 is like having a portable lab right in your paddock. Instead of relying on visual colour matching, this electronic device reads test strips and displays precise digital readings. No more uncertainty about whether the lighting is affecting your colour judgment.
Proven Results
With funding from Te Ahikawariki, we worked with vegetable growers and agronomists to test the Nitrachek 404 across Hawke’s Bay, Manawatu, Pukekohe, and Gisborne. When comparing soil sample Quick Tests against Hill Labs analysis, we achieved 95.5% correlation with laboratory methods when proper protocols were followed.
The economics are compelling too. Laboratory tests cost ~$40 per sample, while Nitrachek strips are about $3 each. For farms requiring frequent monitoring, the device pays for itself very quickly – delivering 90% cost savings per sample.
We have conducted well over a thousand Nitrate Quick Test soil assessments over the last five years. We have identified four key sources of error: sample collection, sample preparation, reading the test strip accurately and reliably, and adjusting for soil moisture content. We have prepared resources for growers taking soil samples so check out our LandWISE Online Learning pages.
We had some major issues comparing our quick test results with those from the commercial laboratory. In some cases, the samples were badly affected by heat or wetness during transport to the lab, resulting in dubious results. But the biggest issue was properly applying the correct soil moisture. To get accurate results, we found that using the soil moisture percentage was critical. We used the online calculator that estimates soil moisture based on your soil type and whether you think the sample is wet, moist or dry. On our MicroFarm soils, this put us 30% out compared to Hill Labs – far too much for budgeting. We worked through issues with Matt Norris from BSI – Plant and Food and found that an equation using actual measured soil moisture made all the difference.
Getting the right answer
We make sure to measure actual soil moisture percentage. We either use a Hydrosense twin-prong soil moisture tester in the field, or we weigh the soil samples that we collect. After sieving the sample for the Quick Test, we dry 100 g of the left-over soil and weigh it again dry. That is easy to do and the most accurate method.
There are still a few maths steps to get from the test strip to the amount on nitrogen in your paddock! You need to calibrate the device, each batch of test strips, adjust for actual soil moisture, soil density, sample depth and, if you want maximum accuracy, add a final lab correction factor to have Quick Test results exactly match laboratory results. That is a bit of a nuisance and leaves lots of room for mistakes, so we developed an online calculator for you.
The online calculator eliminates the complexity of converting raw readings into useful field values. You enter your Nitrachek reading, correction factors, soil moisture content, and soil density, and it converts the data into the nitrate nitrogen values you need (kg/ha).
Practical Considerations
The device isn’t perfect for every situation. Some growers found the one-minute testing time slower than visual estimation for quick field checks. If you just need approximate values for immediate decisions, visual methods still work well.
However, for precise nutrient budgeting, regulatory compliance, or entering specific data into management software, the Nitrachek delivers laboratory-level accuracy at a fraction of the cost.
Getting Consistent Results
Success depends on following proper protocols. The research identified sample handling as crucial – keeping samples cool during transport and processing them promptly significantly improves accuracy. Device and strip calibrations are also essential, as each batch of test strips requires calibration due to manufacturing variations.
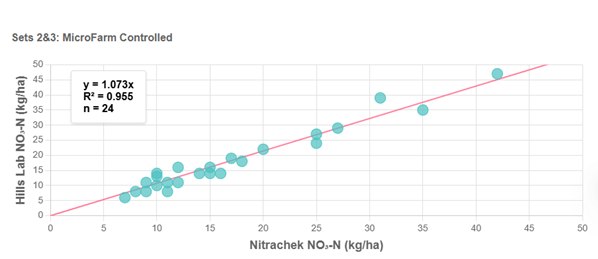
We found the device was accurate within the 2-75 ppm range we tested. That should cover most typical pre-planting conditions in New Zealand vegetable production. The graph below shows results from the MicroFarm and shows an average 7% difference between the quick test and lab results. You might not worry about 7%, but if you do, the online calculator lets you correct it.
For growers focused on precision agriculture and environmental compliance, this represents genuine progress – laboratory-quality soil testing that’s both affordable and immediate.
Download our full report here>
Many thanks to Te Ahikawariki for funding and supporting this work. And many thanks to the growers who took part, tested the method and the device, and gave us useful feedback. And special thanks to Matt Norris for helping us crack the puzzle and providing the “Norris Equation” that properly accounts for soil moisture levels.